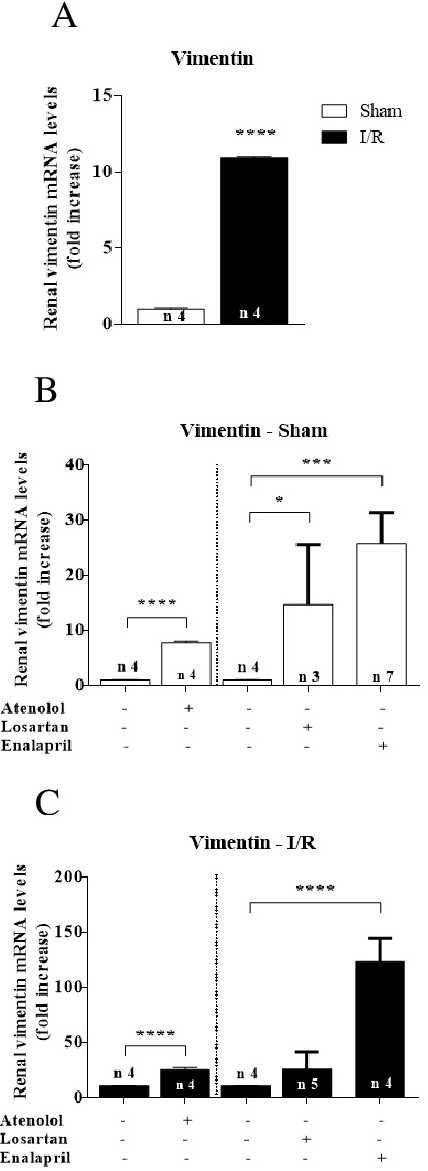
Fig. 2. Vimentin mRNA levels in the left kidney from the Sham (empty bars) and I/R (filled bars) C57BL/6J mice. Influence of treatment with atenolol, losartan, or enalapril. Data are expressed as mean ± SD. The number of experiments using different preparations is indicated within or above each bar. (A) Comparison of renal vimentin mRNA levels between Sham and I/R mice. Means were compared using Student's t-test; ****p<0.0001. (B) Effect of SNS and RAS blockade on renal vimentin mRNA level in Sham mice. Left side: atenolol; ****p<0.0001, as assessed using Student's t-test. Right side: losartan or enalapril, as indicated on the abscissa; *p<0.05, ***p<0.001, as assessed using one-factor ANOVA followed by Bonferroni's test for selected pairs. (C) Effect of blockade of SNS and RAS on renal vimentin mRNA level in I/R mice. Left side: atenolol; ****p<0.0001, as assessed using Student's t-test. Right side: losartan or enalapril, as indicated on the abscissa; ***p<0.001, as assessed using one-factor ANOVA followed by Bonferroni's test for selected pairs.